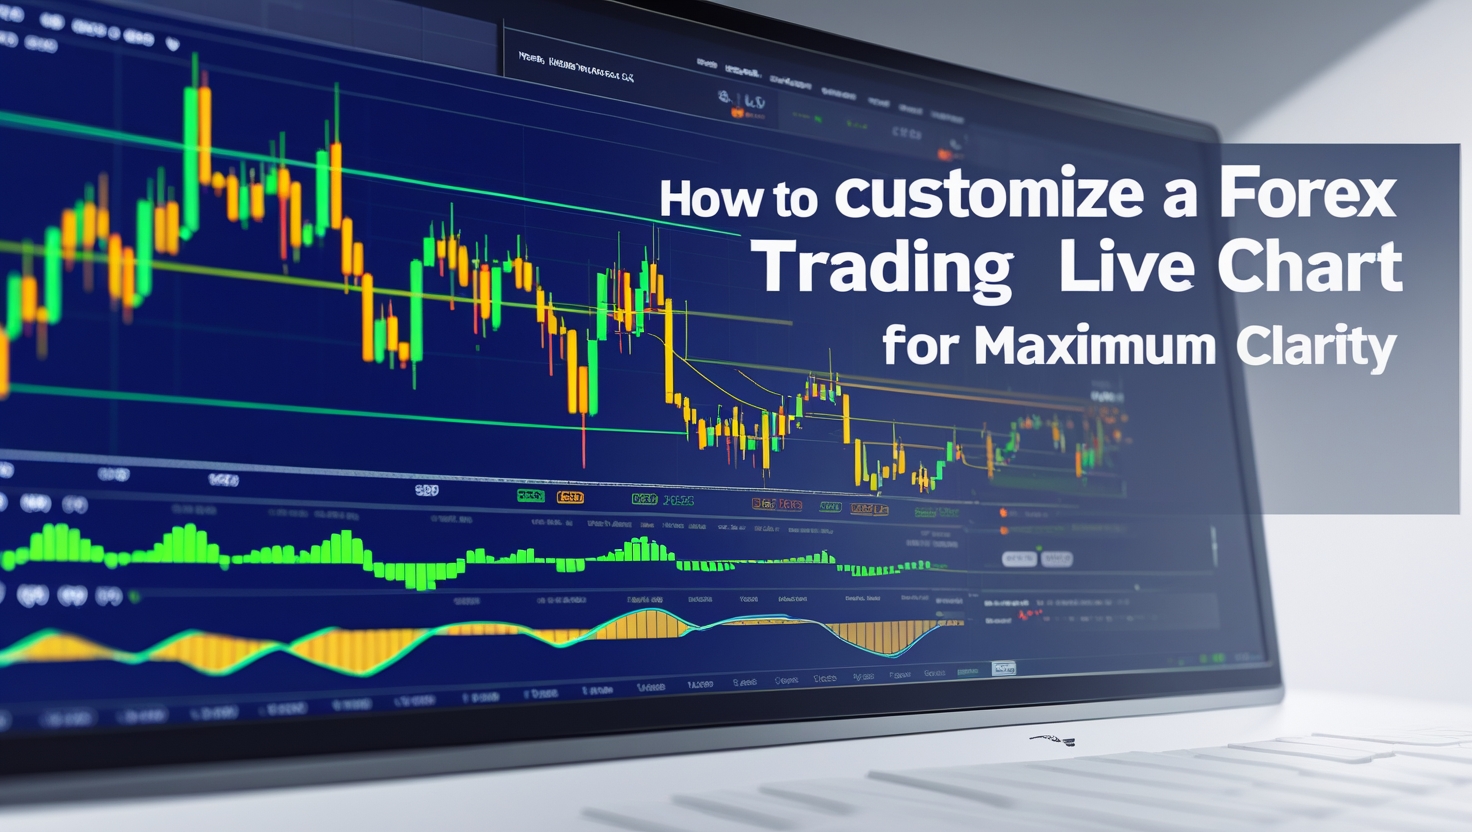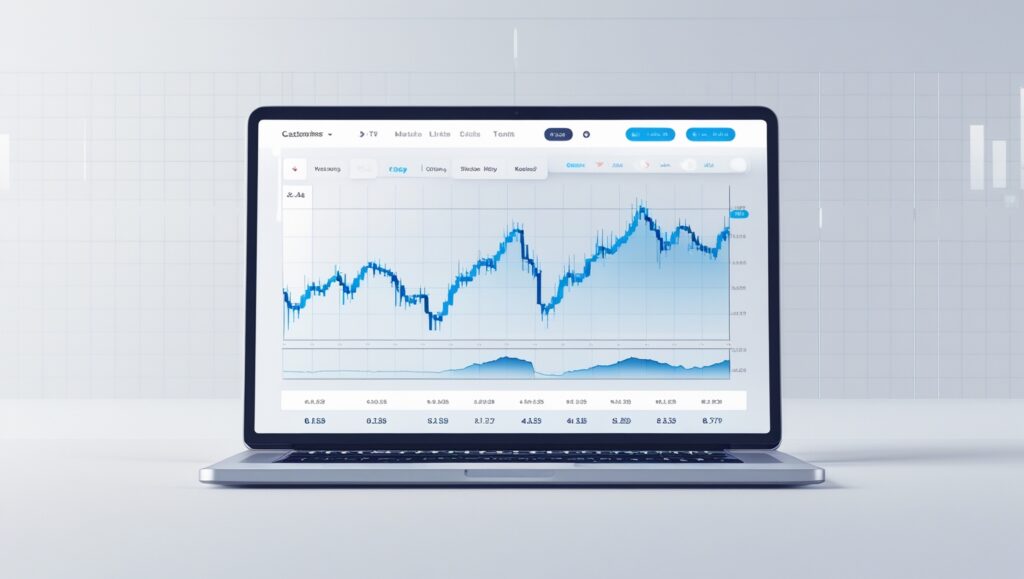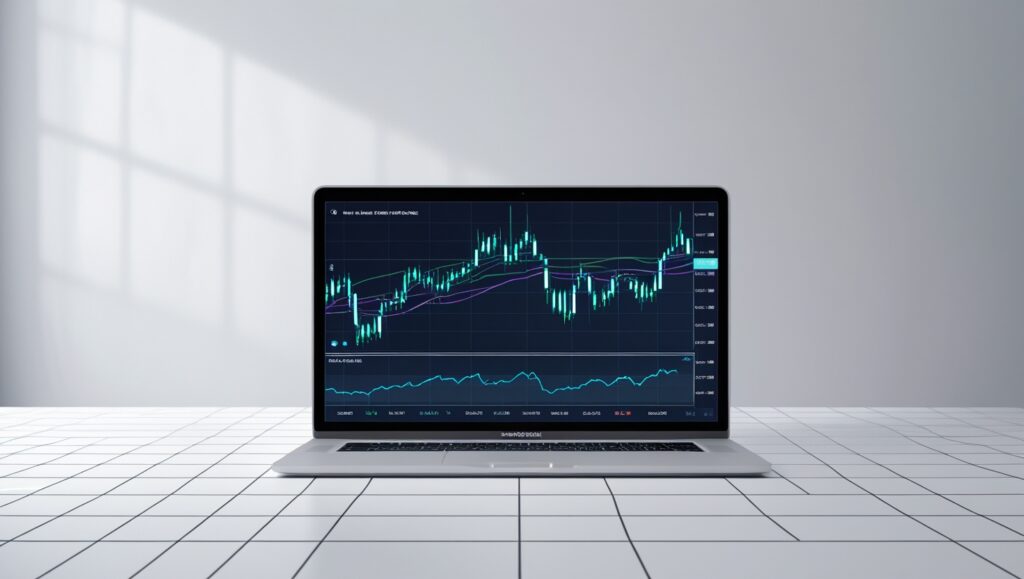
For beginners, a forex trading live chart is an essential tool that displays real-time price movements. Yet a default chart can often look overwhelming – jam-packed with lines, indicators, and colors that make it hard to focus. The good news is you can tailor your chart’s appearance to cut through the noise. By customizing a forex trading graph to suit your needs, you’ll transform a busy investing chart into a clear decision-making aid. In this guide, we’ll walk you through how to personalize your charts step by step (across multiple platforms) for maximum clarity, so you can read the market with confidence.
Overview of Forex Trading Live Charts
| 📊 Element | 🎯 Key Insights | 💻 Platform Tips |
|---|---|---|
| 🚀 Why Customize Your Charts | ||
| Core Benefits |
🧠 Eliminates visual clutter
⚡ Improves decision speed
🎯 Prevents analysis paralysis
📈 Accelerates learning
|
Expert traders favor simplicity over complexity |
| 🔧 Essential Setup | ||
| Chart Type |
Candlestick for forex trading Shows OHLC data clearly Avoid simple line charts |
ALLChart type selector menu |
| Time Frame |
1H/4H for beginners Higher TF = less noise Match your trading style |
Use higher for trend, lower for entry |
| 🎨 Visual Customization | ||
| Appearance |
1Light/dark theme 2Clear candle colors 3Remove grid clutter 4Readable fonts |
MT4/5Right-click → Properties TVSettings gear icon |
| Indicators |
Max 1-2 indicators Popular: Moving averages Test one at a time Each must add unique value |
Avoid indicator overload! |
| 📱 Platform-Specific | ||
| MetaTrader | Switch to black/white background • Save as template • Set as default | MT4/5Template → Save Template |
| TradingView | Extensive options • Disable news markers • Save to cloud | TVCommunity themes available |
| Mobile | Maximize chart area • Extra simple setup • Light/dark mode | 📱Small screen = more simplicity |
| 🏆 Best Practices | ||
| Maintenance |
👁️ Price action priority
🔄 Weekly declutter
📋 Use templates
🎯 Match strategy
|
Clean charts = clear decisions |
Why Customize Your Forex Trading Live Chart?
A default chart isn’t always optimized for clarity. Brokers and platforms often throw in multiple technical indicators, grids, and flashy colors that can confuse more than help. Customizing your chart lets you highlight the information that matters and eliminate distractions. As the old trading adage goes, “With a clear chart comes a clear mind. And when you’re thinking clearly, you’re in a better space to make the right trading decision when it really matters,” says analyst Daniel Adams. In other words, a cleaner chart can improve your focus and discipline.
Experienced traders emphasize simplicity. Forex veteran Nial Fuller notes that “clean charts, or indicator-free charts, are the backbone of my technical analysis and price action approach”. Why? Because cluttered charts – with every indicator under the sun – often lead to analysis paralysis. By contrast, a well-customized chart keeps you focused on price action, key levels, and one or two trusty indicators. This clarity can speed up your learning curve and help you make more objective trading decisions.
Understanding the Basics of an Investing Live Chart
Before diving into customization, make sure you grasp the basic components of a trading chart. A typical investing live chart (whether on Investing.com, TradingView, MetaTrader, or another platform) has these elements:
- Price Axis and Time Axis: The vertical axis shows price, and the horizontal axis shows time. You can adjust the scale of each to zoom in or out. For example, zooming out gives the “big picture” of a trend, while zooming in shows finer detail without changing the timeframe.
- Chart Type: Common types include candlestick, bar, and line charts. Candlesticks are popular in forex because they show open-high-low-close (OHLC) information at a glance. Line charts (often default on some web platforms) show a simple forex trading graph of price over time, but lack detail. Choosing the right chart type is an early customization step.
- Time Frame: This setting defines the period each bar or candle represents (e.g. 5 minutes, 1 hour, 1 day). New traders learning how do you trade forex step by step often start with higher time frames (like 4H or Daily) for clarity, then drill down to shorter ones for entry timing. Select a timeframe that matches your trading style – but remember that higher time frames tend to have less “noise.”
- Indicators and Overlays: These include moving averages, RSI, Bollinger Bands, etc. They’re useful, but too many can overwhelm. It’s best to start with a couple of key indicators that you understand well.
- Drawing Tools: Horizontal lines for support/resistance, trendlines, Fibonacci retracements, and other annotations help mark up important levels. These are part of customization – you’ll add what you need and omit what you don’t.
Understanding these basics on any platform (be it a broker’s software or an investing chart online) will make the following customization steps more intuitive.
Step-by-Step: Customizing a Forex Trading Live Chart for Beginners

Customizing your chart is about making it yours. Follow these general steps (they apply to most platforms, from MetaTrader to TradingView or an Investing.com chart):
- Choose Your Platform and Open a Chart: First, pick a trading platform or charting service. It could be your broker’s software (like MetaTrader 4/5), a web-based chart (like the Investing.com live chart), or a standalone platform (like TradingView). Open a live chart for the currency pair (or instrument) you want to analyze. (Example: If you trade gold, open the XAU/USD chart – a forex trading gold live chart – to customize it for that market.)
- Select the Right Chart Type: Switch to the chart style that best helps you see the market. For forex, candlestick charts are recommended because they convey a lot of information in one glance. Most platforms let you change the chart type via a menu (often an icon showing candlesticks or lines). If your chart was a simple line by default (as some investing charts are), try candlesticks or OHLC bars for more clarity.
- Set an Appropriate Time Frame: Adjust the chart’s timeframe to suit your trading. Beginners might find clarity in using the 1-hour or 4-hour charts to identify the trend, even if they plan to trade on a 15-minute chart. All platforms have a timeframe selector (e.g. 1m, 5m, 1H, 1D, etc.). Pick one and zoom out to see the broader trend, then zoom in gradually. (Remember: zooming doesn’t change the timeframe, it just changes how much data you see.)
- Customize the Chart Appearance (Colors & Grid): Now make the chart visually comfortable:
- Background and Theme: Switch between a light or dark background based on what’s easier on your eyes. Ensure there’s good contrast. For instance, on MetaTrader you can right-click the chart -> Properties to set background color, grid, etc. On TradingView, use the chart settings (gear icon) to find color options.
- Candlestick Colors: Set clear colors for up and down moves. A common scheme is green (or blue) for bullish candles and red for bearish candles. Choose colors you intuitively associate with up vs. down. Avoid neon or overly bright colors that strain your eyes.
- Grid Lines: Consider removing or softening grid lines. Grids can help align points, but too many lines create clutter. Many traders disable the grid or use a subtle grey so the focus stays on price bars.
- Fonts and Scale: Increase font sizes for labels or axes if you struggle to read them. A chart isn’t useful if you’re squinting to see prices.
- Add Key Indicators Sparingly: This is where beginners tend to go overboard. Instead, add one indicator at a time and only if it serves a purpose:
- Moving Averages: You might add a 50-day or 200-day moving average to gauge the trend. They overlay on price and are easy to read.
- Oscillators: If you use an indicator like RSI or MACD, add it in a separate sub-panel. But limit yourself – start with one. Too many indicators can conflict and confuse you.
- Avoid Indicator Overload: Always remember, each new indicator should provide new insight. If it repeats information or you don’t understand it fully, remove it. Less is more. As one guide put it, “The less clutter you see, the less mixed signals you will receive,” meaning a simpler setup yields clearer signals.
- Use Drawing Tools Deliberately: Mark up only what’s necessary:
- Support and Resistance: Draw horizontal lines at obvious support/resistance levels you identify. This helps focus your attention on critical price zones.
- Trend Lines and Channels: If you see a clear trend, draw a trend line. But avoid covering the chart with lines – only draw lines that reflect significant market structure.
- Annotations: Some platforms let you add text notes or arrows. Feel free to label a major high/low or a note like “Fed announcement” on the chart if it helps your analysis. Just don’t annotate every minor swing or you’ll create clutter again.
- Save Your Template/Layout: After customizing, save these settings so you don’t have to redo them each time:
- In MetaTrader, for example, you can save a template (right-click the chart -> Template -> Save Template). Give it a name (e.g., “CleanForexChart.tpl”). Later, apply it to any new chart to instantly load your colors, indicators, and preferences.
- In TradingView or web platforms, you can usually save the chart layout or style. TradingView allows you to save chart layouts to the cloud under your account. Investing.com’s charts may require creating an account to save preferences, but you can still adjust settings each session if not.
- Saving ensures that whether you open a EUR/USD chart or a forex trading gold live chart next time, you can apply the same clarity settings quickly.
By following these steps, you’ll set up a chart that presents information clearly. No more default mess – you decide what appears on your screen.
Cross-Platform Customization Tips
Every trading platform has its quirks, but clarity principles stay the same. Here are a few platform-specific notes for beginners:
- MetaTrader 4/5 (MT4/MT5): MT4 starts with a grey background and grid. Consider switching to a simple black or white background and turning off the grid (via Chart Properties). Use MT4’s Template feature to save your configured chart and load it for all currency pairs. You can even set your template as the default so every new chart opens with your custom style.
- TradingView: TradingView offers extensive customization – take advantage of it. Right-click the chart and choose Settings: there you can modify background, session separators, scales, etc. TradingView also has community-made themes if you want a head start. One tip: disable any default news icons or event markers on charts unless you really want them; they can clutter the view. Save your layout to your account, so your investing live chart setup is consistent whenever you log in.
- Investing.com Charts: The free charts on Investing.com (a popular choice for quick access) can be customized too. Click the settings or chart style options to switch to candlesticks and select a clean color scheme. While you might not get as many options as MT4 or TradingView, you can still hide some indicators or drawings you don’t need. If you use an Investing.com live chart regularly, consider signing up on the site to save your color theme and indicator preferences for next time.
- Mobile Trading Apps: If you’re on a mobile platform (like MetaTrader mobile, or a broker’s app), customization is usually limited. Still, you can often switch between light/dark mode and choose some basic color options. Focus on clarity: for example, maximize the chart area by hiding non-essential panels and use clean colors. Mobile screens are small, so simplicity is even more critical there.
No matter the platform, the goal is the same: make the chart show you exactly what you need, and nothing more. This might take a few iterations – you’ll add an indicator, realize it’s not helpful, then remove it, and so on. That’s normal. Treat it as finding your personal “chart style.”
Best Practices for Clear and Effective Charts

To wrap up the customization process, keep these best practices in mind:
- Prioritize Price Action: Make sure you can always see the price bars or candles clearly. They should stand out as the first thing your eyes notice on the chart. If an indicator or tool is hiding the price action or making it ambiguous, rethink using it.
- Maintain Consistency: Use the same color schemes and general layout across all your charts. For instance, if you trade multiple pairs, apply the same template to each. Consistency helps your brain interpret information faster (you won’t have to remember which color means what on each chart).
- Regularly Declutter: Even after initial setup, periodically review your charts. Have you added too many lines over time? Remove ones that are no longer relevant. Think of it like housekeeping – a quick cleanup keeps the chart readable. Some traders do a weekly reset, deleting old drawings or indicators that aren’t helping.
- Adapt to Your Strategy: Your customization should reflect what you trade and how. A scalper might keep one or two fast-moving indicators and a very zoomed-in view. A swing trader might favor a minimalist approach with just price and one moving average overlaid on a higher timeframe. If you start trading a new strategy, adjust your charts to highlight that strategy’s key inputs.
- Use Templates and Profiles: Beyond individual chart templates, some platforms let you save profiles or workspaces (a set of charts). If you trade forex and stocks, for example, you might maintain a separate profile for each so the chart settings best suit the asset class. But for most beginners, one well-crafted forex chart template is enough – apply it everywhere you can.
By adhering to these practices, you ensure that when you open your trading screen, you’re greeted with an organized, easy-to-read investing chart. You’ll be able to identify trends, spot setups, and gauge market conditions without wading through visual chaos. The bottom line: a clear chart leads to clearer decisions.
Conclusion
Customizing a forex trading live chart for maximum clarity is a small time investment that pays big dividends in your trading journey. It’s not just about aesthetics – it’s about creating an environment where you can think and act like a trader without distractions. Beginners who learn to set up clean charts often find they grasp market concepts faster, because they’re focusing on price movement and key signals rather than fighting through clutter.
Remember, chart customization is part of developing your trading routine. As you gain experience, you might tweak your settings further, and that’s fine. The goal is to continually align your charts with your needs and strategy. With a well-structured chart, you’ll find it easier to follow your trading plan and stick to your strategy (crucial aspects when you’re figuring out how do you trade forex step by step successfully).
In the end, whether you’re examining a major currency pair or a forex trading gold live chart, the principles remain: keep it simple, make it yours, and let clarity drive your analysis. Happy trading!
FAQ
How do you trade forex step by step?
Trading forex step by step involves: (1) Educating yourself on forex basics and key terms; (2) Choosing a reputable broker and setting up a demo or live account; (3) Customizing your trading platform (charts and interface) for clarity as described in this article; (4) Developing a trading plan, including risk management rules and a strategy (for example, using one or two indicators and price action signals); (5) Practicing on a demo account to execute trades based on your analysis; and (6) Gradually going live with real capital once you have consistency. In simple terms, you start by learning and setting up, then progress to analysis, practice, and finally live trading. Each step builds on the previous one, so be patient and methodical.
What is a forex trading live chart and where can I find one?
A forex trading live chart is an interactive chart that shows real-time price data for currency pairs. It updates continuously as the market moves. You can find live forex charts on many platforms. Popular options include broker platforms like MetaTrader or cTrader, financial websites (for example, the free Investing.com live chart tool), and specialized charting services like TradingView. Simply go to one of these platforms, select the currency pair (or other asset) you want to view, and you’ll have a live chart. The chart can usually be customized or analyzed using various tools, as detailed in this article.
How can I customize my chart on MetaTrader or TradingView?
On MetaTrader 4/5, open a chart and right-click to access “Properties.” There you can change colors (for background, grid, bullish/bearish candles, etc.) and style settings. You can also add indicators via the Insert menu and arrange or remove them. Once you’ve set the chart to your liking, save it as a Template (via the Templates menu) so you can reapply those settings easily. On TradingView, use the chart’s Settings (look for a gear icon). This opens a menu with tabs for symbol (candlestick appearance), scales, background, etc. Adjust the colors, toggle grid lines or session breaks, and add indicators from the Indicators menu. Both platforms let you save your layout (TradingView via cloud save, MetaTrader via template files). In short, right-click or use the settings icon to find customization options, tweak what you need, and save the configuration for future use.
Which chart type is best for forex trading – candlestick, bar, or line?
For most forex traders, candlestick charts are considered the best choice. Candlesticks provide detailed information (open, high, low, close) for each period and make spotting patterns or trends easier. Bar charts also show OHLC data and can work similarly, but candlesticks tend to be more visually intuitive (with color-filled bodies indicating direction). Line charts, on the other hand, show only the closing price over time – they can be useful for a quick, simplified view of the overall trend, but they miss a lot of detail and signals that candlesticks or bars provide. Beginners are usually advised to start with candlesticks because they offer a clear visual representation of price action. You might use line charts for uncluttered trend visualization occasionally, but for analysis and trading decisions, candlestick (or bar) charts reign supreme in forex.
How many indicators should a beginner use on their forex chart?
When you’re just starting out, less is more. It’s best to use just one to three indicators at most on your forex chart. In fact, some successful traders begin with zero additional indicators, focusing purely on price action (candlesticks, chart patterns, support/resistance). If you do use indicators, choose ones that complement each other without doubling up. For example, a beginner might use one trend indicator (like a moving average) and one momentum oscillator (like RSI). Too many indicators can lead to conflicting signals and confusion, a trap known as “indicator overload.” By keeping your toolkit small, you can learn what each indicator is truly telling you and make clearer decisions. As you gain experience, you can experiment with more tools, but always ensure each indicator on your chart has a clear purpose.


