10 Most Reliable Forex Trading Patterns Every Trader Should Know
In the ever-evolving world of forex, understanding forex trading patterns is indispensable. Chart patterns are more than just visual phenomena—they reflect the psychology of the market, reveal trader sentiment, and often signal upcoming price movements. Whether one trades intraday or follows longer-term trends, recognizing these structures helps filter noise from real opportunity.
As technical analyst John Murphy once remarked, “The chart tells a story that fundamentals often miss.” This article explores ten of the most reliable forex trading chart patterns, highlighting their significance, variations, and how they influence decision-making across trading styles.
10 Most Reliable Forex Trading Patterns
“The chart tells a story that fundamentals often miss” – John Murphy
| Pattern | Type | Signal | Timeframes | Reliability | Key Characteristics |
|---|---|---|---|---|---|
| Head and Shoulders | Reversal | Bearish | Daily, 4H | High | Three peaks with middle one highest; neckline break confirms reversal |
| Inverse H&S | Reversal | Bullish | Daily, 4H | High | Three troughs with middle one lowest; confirms uptrend |
| Double Top/Bottom | Reversal | Mixed | 1H, 4H | Moderate | Two failed attempts at resistance/support levels |
| Ascending Triangle | Continuation | Bullish | 15m, 1H, 4H | High | Horizontal resistance with rising lows |
| Descending Triangle | Continuation | Bearish | 15m, 1H, 4H | High | Horizontal support with falling highs |
| Symmetrical Triangle | Continuation | Mixed | 1H, 4H, Daily | Moderate | Price compression toward apex; no directional bias |
| Flag Pattern | Continuation | Bullish/Bearish | 5m–1H | Very High | Sharp move followed by rectangular consolidation |
| Pennant Pattern | Continuation | Bullish/Bearish | 15m–1H | Very High | Similar to flag with triangular consolidation |
| Wedge Pattern | Reversal | Mixed | 1H, 4H | Moderate | Converging trendlines; signals trend exhaustion |
| Cup and Handle | Continuation | Bullish | Daily | High | Rounded bottom followed by brief consolidation |
Expert Takeaway: “Technical patterns offer insight, but it’s discipline that determines outcomes.” – Kathy Lien
Head and Shoulders: A Classic Top Signal
Often hailed as the “king” of reversal setups, the Head and Shoulders pattern represents a shift from bullish momentum to bearish sentiment. It consists of three peaks—the middle one being the highest—resembling a human silhouette. The neckline break confirms the trend reversal.
It is important to note that the inverse version of this pattern signals bullish reversals and is equally significant.
“Patterns like Head and Shoulders are not just academic—they are roadmaps traders rely on every day,” says Greg Harmon, founder of Dragonfly Capital.
Double Top and Double Bottom: Visual Simplicity, Tactical Depth
These patterns signal a market’s attempt to breach a level twice—and fail. In a double top, the second peak fails to surpass the first, while a double bottom reflects two unsuccessful attempts to break support. Though simple in appearance, they often mark emotionally charged levels where buyer-seller balance sharply shifts.
There is another thing: false breakouts around these patterns are common. Volume and price action confirmation are essential. Keeping a check on the minute aspects is a key factor that influences good forex trading.
Ascending and Descending Triangles: Geometry in Motion
Triangles form when price begins to compress between trendlines. An ascending triangle, often bullish, features a horizontal resistance level and rising lows. Conversely, a descending triangle usually signals bearish continuation.
Also, breakout strength varies. Wider formations with several touches on the boundaries often precede more explosive moves.
Symmetrical Triangle: When Uncertainty Rules
Unlike its directional siblings, the symmetrical triangle compresses toward an apex with no clear directional bias. Traders often wait for a decisive breakout before committing. While this setup may seem less reliable, its flexibility suits breakout strategies well.
Flag Pattern: Short-Term Power Plays
Flags appear as sharp, almost vertical price moves followed by a rectangular consolidation—resembling a flag on a pole. They usually result in a continuation of the prior trend.
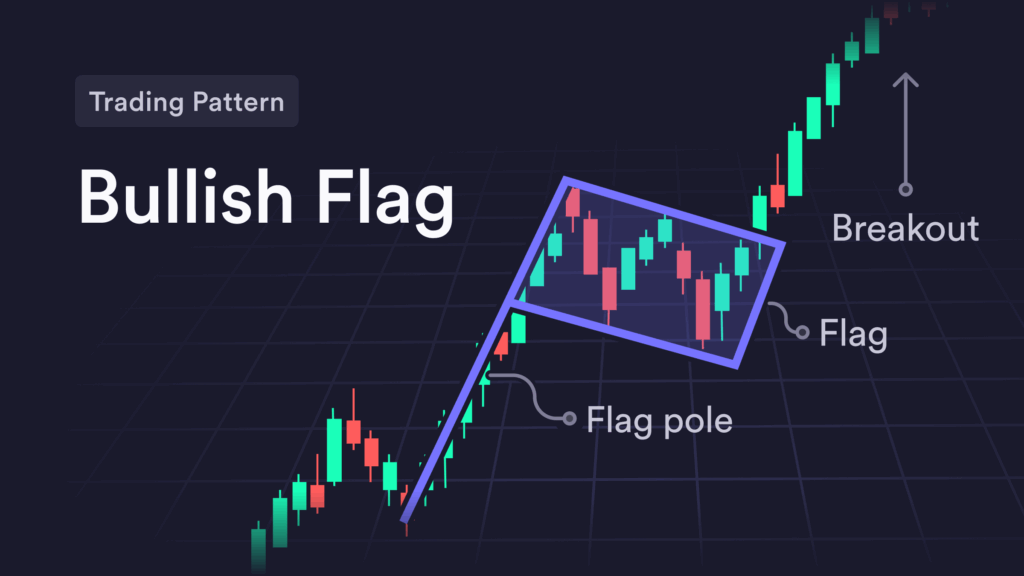
This pattern is particularly favored in fast-paced environments like news releases or volatile pairs (e.g., GBP/JPY). In such moments, momentum is king.
Pennant Pattern: Compact Continuations
Pennants are similar to flags but take on a more triangular shape during the consolidation phase. The key is that both patterns rest on strong prior moves—without momentum, a pennant is just noise. The key is to be able to differentiate between the patterns in terms of their uniqueness.
As has been discussed earlier in the article, breakout confirmation is essential. False signals can lead to poor risk-reward outcomes.
Wedge Patterns: Slowing Momentum, Imminent Change
Falling and rising wedges differ from triangles due to their converging trendlines sloping in the same direction. Rising wedges typically signal bearish reversals, while falling wedges can point to bullish turnarounds.
These patterns often emerge during trend exhaustion and require confirmation through breakout volume.
Cup and Handle: A Bullish Breakout Favorite
Resembling the silhouette of a tea cup, this pattern features a rounded bottom followed by a brief consolidation (the “handle”). When price breaks above the handle’s resistance, bullish continuation is likely.
This setup is popular among swing traders and often appears in higher timeframes. Its reliability increases with well-formed, smooth curves.
Bonus: Forex Patterns Cheat Sheet
| Bullish Patterns | Bearish Patterns |
|---|---|
| Inverse Head and Shoulders | Head and Shoulders |
| Double Bottom | Double Top |
| Ascending Triangle | Descending Triangle |
| Falling Wedge | Rising Wedge |
| Cup and Handle | Broadening Top |
This cheat sheet helps visualize relationships between patterns and their expected outcomes.
Trading Patterns vs. Time: How Many Forex Trading Days in a Year?
The forex market remains open 24 hours a day, five days a week. Accordingly, there are roughly 252 trading days in a year. However, practical availability varies due to regional holidays, broker maintenance windows, and volatility around global events.
Patterns evolve across timeframes—from five-minute charts to daily setups—so understanding when and where to use them becomes an art, not just a science.
Conclusion: Patterns Are Tools, Not Guarantees
Recognizing trading patterns in forex is akin to reading a language. One may misinterpret or over-anticipate signals, especially when trading emotionally. Patterns are guides, not promises. Combine them with volume, confirmation indicators, and risk management principles.
As Kathy Lien puts it, “Technical patterns offer insight, but it’s discipline that determines outcomes.”
Conclusively, while forex trading chart patterns offer a structural edge, mastering them requires patience, context, and continuous learning.